
Payroll Tax Cuts Boost Economy - 1/31/13
 | Just as Congress allowed the 2011-12 payroll tax cut to expire, new research by the Federal Reserve Bank of New York suggests that such tax breaks may significantly boost consumer spending. As a result, raising workers’ take-home pay this way might play a bigger role than many thought in reversing economic slumps. More |
Investment Slump Goes On - 1/31/13
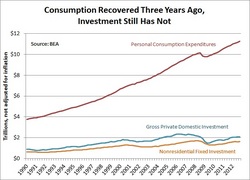 | Investment has yet to fully recover from the recession, in nominal terms, much less in real terms. Gross domestic investment has been increasing since it bottomed out in the 3rd quarter of 2009, but it remains about $270 billion below its peak in the 2nd quarter of 2006. More |
Failed Predictions of Doom - 1/29/13
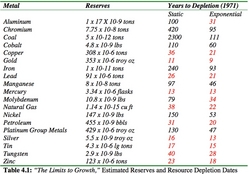 | While searching for something else, I came across this entertaining collection of grand predictive failures related to resources and climate change, along with some of the biggest predictive failures of Paul Ehrlich. More |
Public Debt, Private Debt - 1/29/13
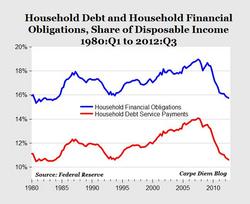 | While total federal debt has skyrocketed to more than 100% of the nation’s GDP in 2012, the burden of US household debt fell to its lowest level in third quarter last year in almost 30 years. More |
Our Next Big Debt Bomb - 1/28/13
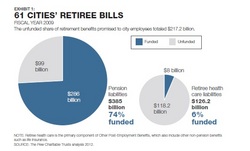 | A new study notes that they on average cities have higher unfunded liabilities for health care promises made to retirees than for pensions and have set aside very little to pay for the future health care promises they have made to workers. That amounts to a fiscal tidal wave. The problem, as the chart suggests, lies in the grey areas of the two pie charts... More |
The Old Old World - 1/28/13
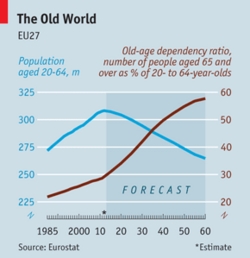 | Even if a sturdier recovery does eventually get under way in Europe, its longer-term growth prospects will be dulled by an unwelcome new demographic trend. More |
Uncertainty and Unemployment - 1/25/13
 | Increased uncertainty has a negative impact on economic activity by reducing demand, as firms and households delay investment and consumption. Heightened uncertainty also lowers employment, as firms hold off hiring new workers. More |
How Money Walks - 1/25/13
 | Between 1995 and 2010, millions of Americans moved between the states, taking with them over $2 trillion in adjusted gross incomes. Two trillion dollars is equivalent to the GDP of California, the ninth largest in the world. It’s a lot of money. Some states, like Florida, saw tremendous gains ($86.4 billion), while others, like New York, experienced massive losses ($58.6 billion). People moved, and they took their... More |
Texas Eyes Pension Debts - 1/24/13
 | Texas comptroller Susan Combs has decided to make a signature issue out of pension reform. For it happens to be the case that Texas, too, has a pension problem, especially at the municipal level. Houston currently devotes 13.4% of its general fund spending to pensions, a figure which is projected to rise to 17% by 2017. Some Texas cities have been unable to resist the allure of pension obligation bonds. Collectively,... More |
Lifespan and the Middle Class - 1/24/13
 | Don Boudreaux and I address the myth that America’s middle class has stagnated in recent decades, here’s an excerpt: No single measure of well-being is more informative or important than life expectancy. Happily, an American born today can expect to live approximately 79 years—a full five years longer than in 1980 and more than a decade longer than in 1950. These longer life spans aren’t... More |
Parental Subsidies and College Grades - 1/22/13
 | Much discussion about higher education assumes that the children of wealthy parents have all the advantages, and they certainly have many. But a new study reveals an area where they may be at a disadvantage. The study found that the more money (in total and as a share of total college costs) that parents provide for higher education, the lower the grades their children earn. |
Taxes, Tolls and Spending on Roads - 1/22/13
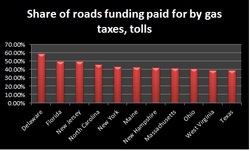 | The lion’s share of transportation funding should come from user taxes and fees, such as tolls, gasoline taxes, and other user-related charges. When road funding comes from a mix of tolls and gas taxes, the people that use the roads benefit from them and should bear a sizeable portion of the cost. But nationwide in 2010, state and local governments raised $37 billion in motor fuel taxes and $12 billion in tolls and... More |
Income Distribution By Age - 1/21/13
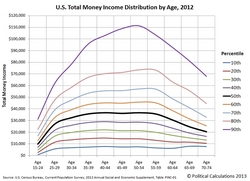 | The data in the chart represents the income distribution for the estimated 194,271,175 Americans from Age 15 through Age 74. More |
Investing in Infrastructure - 1/21/13
 |
The U.S. economy certainly needs infrastructure. The important policy issue, however, is who can deliver it most efficiently—the federal government, state and local governments, or the private sector. Decades of experience show that when the federal government gets involved in infrastructure, investment often gets bogged... More |
Local Governments' Lobbying Bill - 1/18/13
 | States and cities spend $81 million annually lobbying the federal government. More |
The Trade Deficit and Growth - 1/18/13
 | During the past 10 years, there has been a clear relationship between trade deficits and U.S. economic growth. Most news coverage gets the relationship backwards. More |
Jindal's Tax Plan By The Numbers - 1/17/13
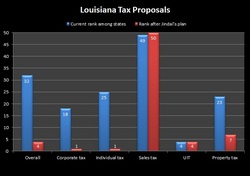 | How changes in tax rates proposed by Louisiana's governor would affect that state's ranking in terms of tax competitiveness. More |
Slowing World Growth - 1/17/13
 | The world’s growth continued to slow in the third quarter of last year, according to The Economist's measure of global GDP, based on 52 countries. More |
Who Really Owns Our National Debt? - 1/15/13
 | Overall, U.S. entities own just 65.8% of all debt issued by the U.S. federal government. Ranking the major U.S. entities from low to high, we find that... More |
Europe: Rhetoric and Reality - 1/15/13
 | Last week, in what appears to have become a six-monthly ritual, Jose Manuel Barrosso, the President of the European Commission, came out with yet another one of his periodic reassurances that the worst of the Euro crisis was behind us. Yet no sooner did he provide that reassurance than new data suggested that if anything, the European economic recession deepened in the fourth quarter of last year. More |
California's Wall of Debt - 1/14/13
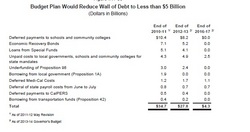 | California faces what Jerry Brown calls a 'wall of debt' it accumulated by using borrowing instead of revenues or spending cuts to balance its budget over the last few years. In fact a big chunk of the new revenues from the tax increase, some $4.2 billion next fiscal year, will go to pay off that debt. More |
Is 49 A Magic Number? - 1/14/13
 | The aggregate amount of regulation is difficult to quantify, but we learn something about it from the number of businesses that choose to have exactly 49 employees. More |
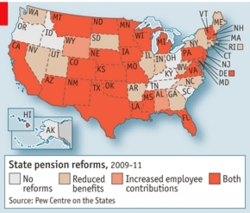
Pensions: The Fiscal Black Hole - 1/11/13
 | There are fiscal cliffs, then there are fiscal black holes. The difference? The cliff, you fall over just once. But a black hole increases its pull on you more and more each day. And that's a disturbingly accurate description of the problem now faced by Rhode Island and virtually every other state: the ever-growing challenge of underfunded pensions for government employees. Regardless of the fate of Rhode Island's pension... More |
Corporate Tax Reform - 1/10/13
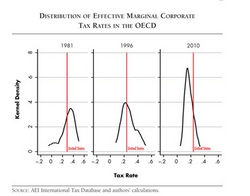 | What makes for a competitive, pro-market, pro-growth corporate tax code? More |
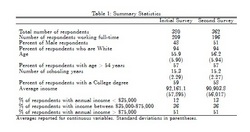
Household Income and Demographics - 1/10/13
 | Most of the discussion on income inequality focuses on the relative differences over time between low-income and high-income American households, but it’s also instructive to analyze the demographic differences among income groups at a given point in time to answer the question: How are high-income households different from low-income households? More |
The State, Local Job Decline - 1/10/13
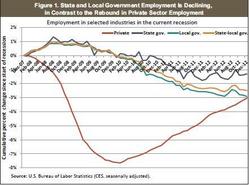 | The private sector lost more jobs, more quickly, than the public sector since the beginning of the Great Recession. However, the private sector has been slowly recovering for three years, whereas state and local job losses have continued. More |
The Demographics of Job Gains - 1/08/13
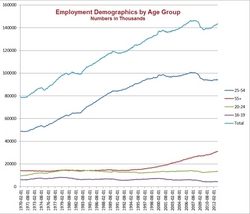 | Note that 100% of the job growth since the recession is in a single age group. More |

Cities Stuck In Pension Morass - 1/07/13
 | While it hasn't gotten the attention of the "fiscal cliff" in Washington, the pension crisis at city halls around America could have similar effects as mayors are forced to raise taxes, cut government services or renege on retirement promises made to police officers, firefighters, teachers and other public workers. More |
Those 1950 Tax Rates - 1/07/13
 | Tax rates were high in the 1950s, we often hear, yet economic growth boomed. So why should we fear higher taxes today? One answer is that taxes in the 50s weren’t really high. More |
Northeastern Exodus - 1/04/13
 | The Northeast region leads the United States in outbound migration, according to the results of United Van Lines’ 36th annual “migration. More |
Failing Teacher Pensions - 1/03/13
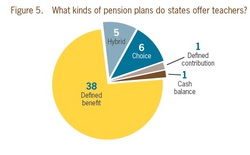 | The structure of teacher pension systems in the United States is by and large untenable, a new report concludes. More |
Geography and Inequality - 1/03/13
 | While college graduates have received a rising pay premium over those with only high school educations, college grads are increasingly congregating in cities where the cost of living is higher. More |
NY: Crossing the 50% Tax Bar - 1/03/13
 | For residents of New York City, the combined federal-state-local income tax bite will now consume over half of every added dollar of income for couples earning roughly $500,000 or more. More |
Americans Living Alone - 1/02/13
 | The percentage share of single person households in the U.S. doubled in the 28 years from 1940 to 1968. It then took another 20 years for the percentage share of single person households to more than triple its 1940 level, reaching that mark in 1988.These changes help explain changes in household income inequality. More |
The Junk Curve - 1/02/13
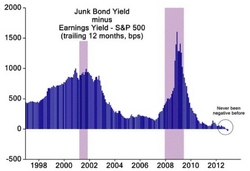 | This chart, more than almost any other, may highlight the potential harm induced by the Federal Reserve’s attempts to push private investors further out on the risk spectrum. More |
